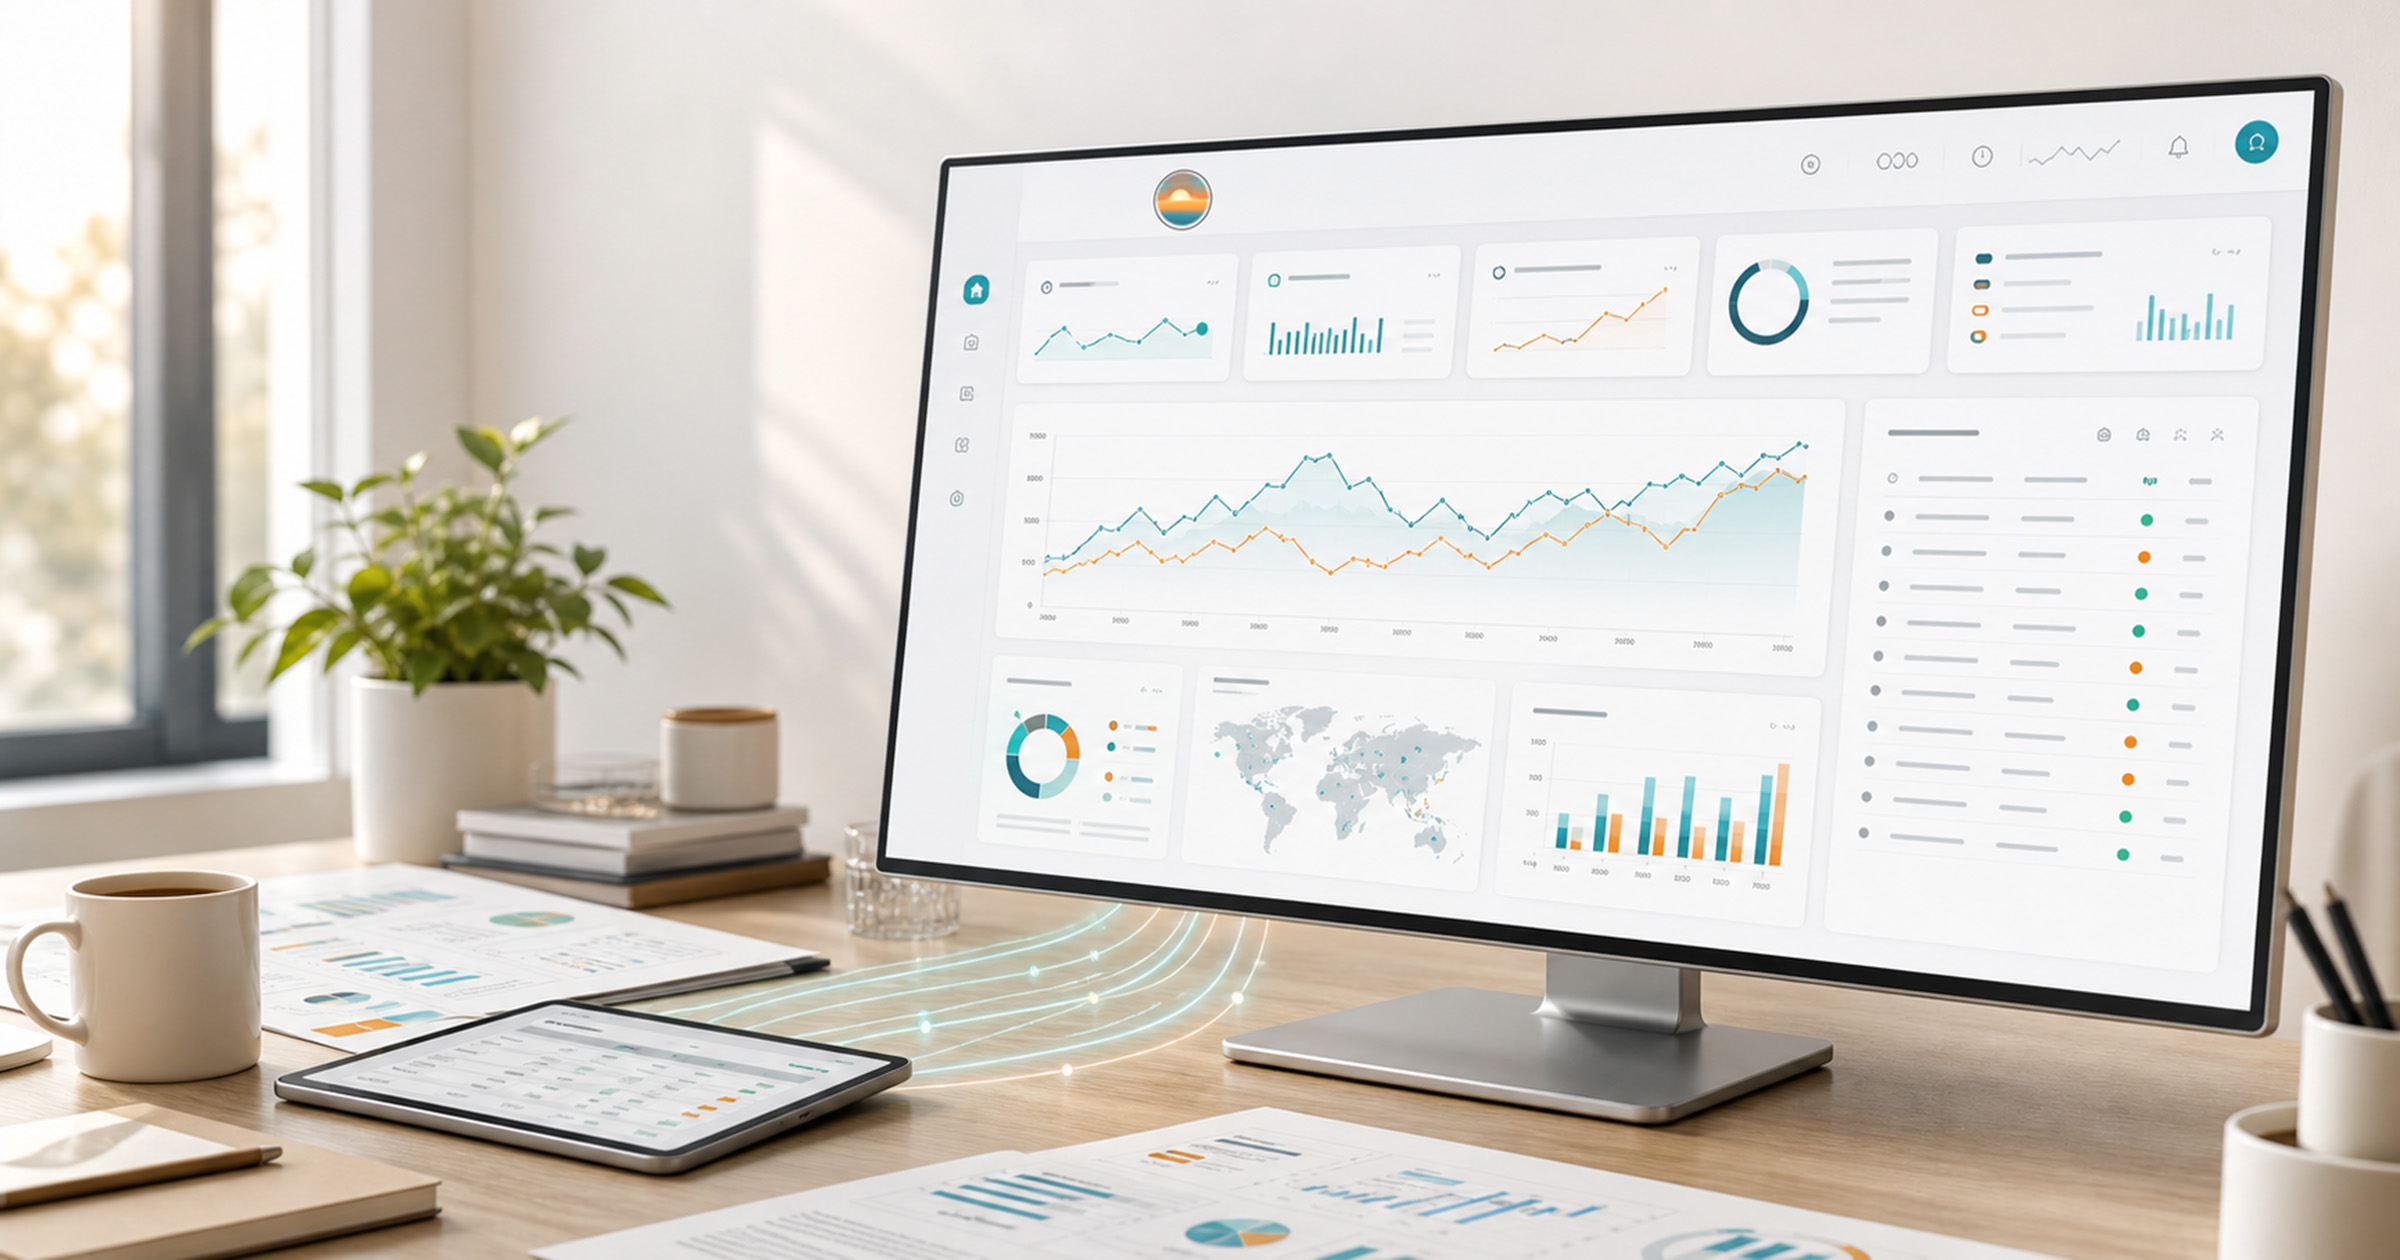
Dawn can now create live dashboards. Ask an agent to turn workspace context, files, connected sources, or generated data into an interactive view, then inspect the dashboard directly from Dawn or open it as a standalone page.
Sometimes a paragraph is not enough. A team wants a status board, a launch tracker, a customer-health view, a compact analytics report, or a small operational dashboard that can be refreshed and revisited. Live Dashboards let Dawn produce that kind of surface without making the team leave the conversation to build it from scratch.
Not the Same as HTML Prototypes
Live Dashboards and HTML Prototypes both produce visual HTML output from a conversation, so it is worth being clear about what separates them.
HTML Prototypes are for design work: mocking up a screen, prototyping a new feature, sketching a landing page. The output uses placeholder content on purpose — you are exploring what something should look like, not reading real data. A prototype helps answer “what should this be?”
Live Dashboards are for operational views that need to reflect actual state. The agent queries connected sources, reads files, and pulls from agent-generated datasets to populate the view with current information. A live dashboard helps answer “what is happening right now?” The right tool is a KPI board drawing from Google Analytics, a release readiness view over open PRs and failing tests, a support queue snapshot from Jira, or a campaign health report combining several data sources.
Use HTML Prototypes for screens and design. Use Live Dashboards for reports, KPIs, and instrumentation views.
From Answer to View
Dawn already helps teams summarize, compare, and generate files. Live Dashboards take the next step: the output can become an interactive view.
For example, ask Dawn to review a set of customer notes and build a risk dashboard. Ask it to turn a CSV into a filterable summary. Ask it to combine connected-source data with a generated dataset and show the result as a compact status page. Instead of returning only prose, Dawn can produce a dashboard that the team can inspect, revise, and share.
That makes dashboard creation feel closer to the rest of the work. The same thread that contains the question also contains the reasoning, the generated source files, the preview, and the follow-up changes.
Built From the Context You Already Have
Live Dashboards are useful because Dawn can start from the material already available to the agent: workspace files, attachments, generated files, connected sources, memory pages, and the conversation itself.
If the data is in a spreadsheet, Dawn can read it. If the data is produced by an earlier run, Dawn can use it. If the data comes from a connected source, an assigned agent can query that source and shape the result into something visual.
That does not replace specialist analytics tools. It gives teams a fast way to create a purpose-built view around the question they are already asking.
Iterate in the Same Thread
The first dashboard rarely needs to be perfect. The useful loop is to inspect it, ask for changes, and keep the source connected to the conversation.
You might ask:
Make this dashboard focus on overdue items and add a severity filter.
Group the customer risks by owner and add a short action column.
Turn the summary cards into a trend view for the last 30 days.
Because the dashboard stays connected to the thread, the revision loop is natural. The team does not have to copy code into another editor or rebuild the context in a separate tool.
Share the Result When It Is Useful
Some dashboards are only useful inside the conversation. Others should be opened as a standalone view or shared with teammates. Dawn supports both patterns.
Use the in-thread preview while building. Open a standalone view when the dashboard needs more space or when the result should live outside the chat. The dashboard remains tied to its revision history and source files, so follow-up work can continue later.
Good Uses for Live Dashboards
Live Dashboards are best for focused operational views: launch readiness, customer risk, PR review summaries, test coverage snapshots, campaign status, support queue health, lightweight analytics, or a one-off report that needs filtering and visual structure.
They are not meant to replace a full BI platform or a production application. If the team needs governed enterprise reporting, central metrics definitions, or a long-lived application with a full product lifecycle, those tools still matter. Dawn is best when the team needs a practical view quickly, grounded in the work already happening in the workspace.
Getting Started
Ask Dawn for a dashboard directly from a thread:
Create a live dashboard from this spreadsheet that shows open risks by owner, severity, and due date.
Or start from a connected source:
Build a dashboard that summarizes the open pull requests waiting for review and highlights stale ones.
Review the preview, ask for changes, and open the standalone dashboard when it is ready. Live Dashboards give teams a way to move from “tell me what changed” to “show me the current state” without leaving Dawn.